Dynamic Gauge Colors for JET Visualizations
The gauges created by JET’s <oj-status-meter-gauge> are pretty, but I wanted to dress up the colors a bit. I especially wanted to replicate the JustGage fade that smoothly goes from color to color:
Oracle JET has some dynamic color capability for the gauge visualizations, but it revolves around setting a thresholds array with distinct boundaries. The cookbook has example code that sets three levels for all gauges at 33, 67, and max, with red, yellow and green as the respective default threshold colors:
...
this.thresholdValues = [{max: 33}, {max: 67}, {}];
...
This array is used on the thresholds="[[thresholdValues]]" attribute of the status meter in the cookbook’s HTML. But we’re not limited to just three levels or colors, nor are we limited to just one thresholds array. We can create unique thresholds and color schemes for each of our gauges. This freedom is good when the default red-yellow-green colors don’t match your requirements, such as how showing red for a low temperature just doesn’t feel right.
In the JSFiddle below, notice how there’s a settings object for each gauge, including independent ranges and colors for the thresholds.
...
self.thermometerScale = {
min: -20,
max: 120,
thresholds: [
{max: 0, color: "deeppink"},
{max: 10, color: "magenta"},
{max: 20, color: "purple"},
{max: 30, color: "blue"},
{max: 40, color: "skyblue"},
{max: 50, color: "green"},
{max: 60, color: "yellowgreen"},
{max: 70, color: "yellow"},
{max: 80, color: "orange"},
{max: 90, color: "red"},
{max: 100, color: "firebrick"},
{max: 120, color: "maroon"}
]
};
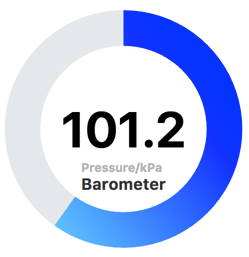
self.barometerScale = {
min: 93.1,
max: 106.7,
thresholds: [
{max: 96.0, color: "dimgray", shortDesc: "stormy"},
{max: 98.2, color: "darkblue", shortDesc: "rain"},
{max: 101.2, color: "lightskyblue", shortDesc: "change"},
{max: 104.0, color: "deepskyblue", shortDesc: "fair"},
{max: 106.7, color: "goldenrod", shortDesc: "very dry"}
]
};
self.hygrometerScale = {
min: 0,
max: 100,
thresholds: [
{max: 40, color: "khaki ", shortDesc: "dry"},
{max: 60, color: "darkseagreen", shortDesc: "comfort"},
{max: 100, color: "aqua", shortDesc: "wet"}
]
};
...Get me some of that sweet gradient
So this is fine for rough ranges: it gives us suitable colors matching the gauges’ purpose and lets us define the color-change points on the scale. But the transitions are rather abrupt – you’re the same color up until just below the max of a range, and then suddenly you’re a different color.
We could soften our color choices and make them more similar to a gradient or perhaps set up tinier and tinier ranges, but why not get JET to figure out how to transition the colors smoothly?
I’m sure smarter people than me can figure out a better algorithm, but one approach is to hook into the SVG rendering that JET does behind the scenes by adding an svg-style attribute to the <oj-status-meter-gauge>. This attribute expects a JSON object of CSS styling that will get applied to the gauge when its SVG is generated. Following the thoughts in the blog article Chart Custom Fill and Stroke, we could even pass in chunks of SVG – like a linearGradient definition – to achieve a smooth fade:
<svg height="0" width="0">
  <defs>
    <linearGradient id="gradient" x1="0%"  y1="100%">
      <stop offset="0%" style="stop-color: #66ccff"></stop>
      <stop offset="80%" style="stop-color: #0000FF"></stop>
    </linearGradient>
  </defs>
</svg>

<oj-status-meter-gauge
  id="barometer"
  min=[[thresholds.barometerMin]]
  max=[[thresholds.barometerMax]]
  data-title="Barometer"
  data-label="Pressure/kPa"
  value="{{barometer}}"
  orientation="circular"
  center.renderer="[[oj.KnockoutTemplateUtils.getRenderer('centerTemplate')]]"

  svg-style=' {"fill": "url(#gradient)"} '

  style="align:center;margin-top:5px;margin-bottom:5px;height:240px;width:25%;"
  class="oj-flex-item">
</oj-status-meter-gauge>
Another option is to hook up the svg-style with a function from the backing viewModel, one that can take parameters and return an object of style built from the current value and scaled to the min and max:
Below is some code I’m not proud of, because what I really wanted to do is hook an event on the gauge’s value change or refactor out a generic, reusable function that all gauges could use, or something elegant like that. But I couldn’t figure out a way to pass in the gauge’s context or an onchange event, and instead the function parameters are clunky and ham-handed. Still, maybe this is the start of something, or maybe there’s a better way to approach dynamically styling the gauges as the values change?
view.html
<oj-status-meter-gauge
  id="thermometer"
  min=[[thresholds.thermometerMin]]
  max=[[thresholds.thermometerMax]]
  data-title="Thermometer"
  data-label="° Fahrenheit"
  value="{{thermometer}}"
  orientation="circular"
  center.renderer="[[oj.KnockoutTemplateUtils.getRenderer('centerTemplate')]]"

  svg-style="[[customSvgStyle(thermometer(), thresholds)]]"

  style="align:center;margin-top:5px;margin-bottom:5px;height:240px;width:25%;"
  class="oj-flex-item">
</oj-status-meter-gauge>
viewModel.js
// don't forget to include dependencies for ojcolor and ojvalidation
define([
  ...,
  'ojs/ojvalidation-base',
  'ojs/ojcolor'
],


...


self.customSvgStyle = function(value, thresholds){
  return {
          fill: getColorAtScalar(value, thresholds.max, thresholds.min)
        };
};

function getColorAtScalar(value, max, min) {

  // create a color converter for output into rgb for svg fill style
  var cf = oj.Validation.converterFactory(oj.ConverterFactory.CONVERTER_TYPE_COLOR);
  var convHsl = cf.createConverter({"format": "rgb"}) ;

  // get the starting and ending colors' RGB values into an object
  var lowColor = oj.Color['blue'.toUpperCase()] ;
  var lowColorObject = {
                        r: lowColor.getRed(true),
                        g: lowColor.getGreen(true),
                        b: lowColor.getBlue(true)
                      };
  var highColor = oj.Color['firebrick'.toUpperCase()] ;
  var highColorObject = {
                         r: highColor.getRed(true),
                         g: highColor.getGreen(true),
                         b: highColor.getBlue(true)
                       };

  // figure out the multiplier for the value's position in the range
  var fraction = value / (max - min);

  // create an RGB object with new values using the fraction multiplier
  var scaledColorObject = {
    r: lowColorObject.r + (fraction * (highColorObject.r - lowColorObject.r)),
    g: lowColorObject.g + (fraction * (highColorObject.g - lowColorObject.g)),
    b: lowColorObject.b + (fraction * (highColorObject.b - lowColorObject.b))
  }

  // create a Color out of that and return it in rgb() format
  var scaledColor = new oj.Color(scaledColorObject)

  return convHsl.format(scaledColor);

}

...